
Are you designing a pond with a sloped bottom? If so, you may be interested in this technique.
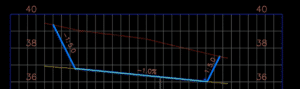
To watch the short video demonstrating the complete quick step-by-step process, click here.
Are you designing a pond with a sloped bottom? If so, you may be interested in this technique.
To watch the short video demonstrating the complete quick step-by-step process, click here.
It’s relatively easy to create a custom component road assembly within an Infraworks model. But how does one save that custom assembly for use later? Read on to find out!
The answer depends on how you’d like it to be shared:
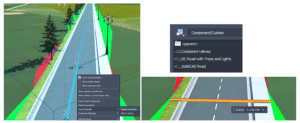
First, to save a custom assembly, simply right click the component road and choose Add to Library. Choose a station to copy and give the new assembly a name. The new assembly will appear in the style palette.
Choose a station to copy and give the new assembly a name. The new assembly will appear in the style palette.
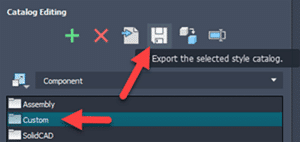
The individual assembly cannot be exported, but the catalog can. Select the catalog, in this case, Custom, and click to export to a JSON file.
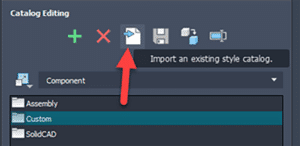
The JSON file can then be imported into a different existing model using the import button. The assembly will be available in the styles palette.
There is no “tool” for this, but if one copies the appropriate files from and to the correct locations, then it works just fine. The custom assembly files can be found in the model’s folder path.
…model.files\unver\Content\Styles\Component\ . Possibly in a Custom sub-folder.
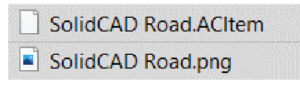
There will be 2 files for each assembly. A PNG image and a ACItem file.
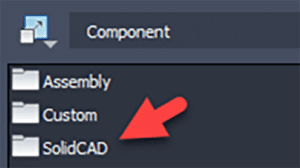
Copy these two files to the Infraworks standard folder. Feel free to create a sub-folder here to place your custom assemblies. This folder will appear within Infraworks.
C:\ProgramData\Autodesk\InfraWorks\Resources\LocalLibrary\Styles\Component\
The JSON file can then be imported into a different existing model using the import button. The assembly will be available in the styles palette.
Many of our customers desire the ability to transform Civil 3D data between coordinate systems. This was challenging or impossible…until now! Read on…
It is available for Civil 3D 2019-2022. Read more about this extension here.
The Autodesk® PPK Survey Extension 2022 for Civil 3D® provides an interface for importing GPS data (in RINEX format) for analysis, reporting, and converting it to coordinate geometry points in an Autodesk Civil 3D drawing. Once installed, users can access the Autodesk PPK Survey Extension 2022 for Civil 3D commands via the Autodesk Civil 3D Toolbox.
Under COGO Points Transformation Tools:
Under GNSS Data Processing:
We are excited to share with you the highlights of the latest Autodesk Desktop Connector update!
Enhancements are:
There have been significant changes to folder sharing. If you have folders shared, it is recommended to educate yourself on the new behavior.
The new behaviour is outlined here and here.
For more information, visit this link.
We are pleased to announce that our partner CTC Software released Civil 3D CIM Project Suite, version 22.0.3. It is now released and can be accessed on the CTC website.
Below are release notes:
| 22.0.3 | 9/17/2021 | CIM Project Suite | Auto Grader | Bug Fix | Fixed an issue where “split points” in parent feature lines were causing an error. Fixed an issue where creating parallel child lines with a specified station range caused unexpected results. Fixed an issue where inward and outward offsetting was giving unexpected results. Fixed an issue where perpendicular child feature lines were not creating at the user-defined station values. Misc. user interface improvements. |
| 22.0.3 | 9/17/2021 | CIM Project Suite | Corridor Mapper | Bug Fix | Fixed an issue where corridors with disabled regions were causing the app to fail. Fixed an issue in how the app dealt with corridors containing previously mapped targets. |
| 22.0.3 | 9/17/2021 | CIM Project Suite | Corridor Splitter | New Features | Added interactive region selection and graphical highlighting, providing a much more intuitive app workflow. |
| 22.0.3 | 9/17/2021 | CIM Project Suite | Earthwork Processor | Bug Fix | Fixed an issue where the region offset command would not work on very small region objects. |
| 22.0.3 | 9/17/2021 | CIM Project Suite | Label Genie | Bug Fix | Fixed an issue where pipe networks could no longer be labelled. |
| 22.0.3 | 9/17/2021 | CIM Project Suite | Pipe Planner | Bug Fix | Fixed an issue where part elevations were not updating in the app after applying changes to the drawing. Fixed an issue where part elevations were not updating when importing external spreadsheets. Fixed an issue where pipe lengths for the pipe depth at interval property were not calculating correctly. Fixed an issue where parts of the same name, but in different pipe networks, were not allowed by the app. Fixed an issue where the structure rotation angle was incorrectly rounding. |
In this blog, our Civil/Infrastructure Technical Product Specialist, Jae Kwon, will cover how a Civil 3D user can use an automatic way to create surface statistics labels with Dynamo.
Instead of Civil 3D users manually labelling surface statistics for his surfaces with a manual process, they can explore an automatic way using Dynamo. Let’s take it further below by comparing the existing manual method versus the Dynamo Solution.
The existing method by the user was the following:
2. Paste the info into notepad and rearrange the text to get the desired format
3. Copy-paste the info into an Mleader pointing to the surface.
This method works, but there is a lot of manual formatting involved every time, and this has to be repeated every time there is a surface update.
Also, we cannot create a surface label style for this kind of label since there are no statistics properties we can pull from the surface labels (spot elevation, contour and slope).
Now, let us look an automatic solution to this via Dynamo.
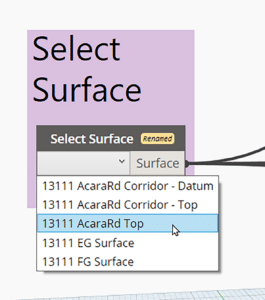
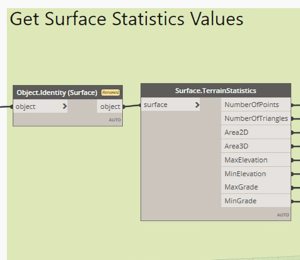
First, we get the user to select the surface they want to label with a simple drop-down list. This may be done through either the Surfaces node from the Civil 3D Toolkit (shown below) or a UI package like Data Shapes.
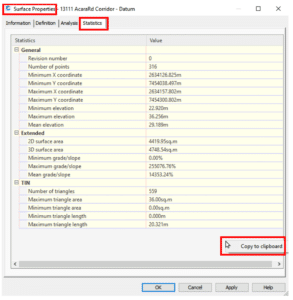
Next, we extract the statistics with the Surface TerrainStatistics node.
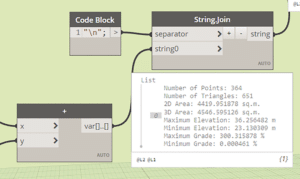
The statistics can then be formatted with various text manipulation nodes. But where can we inject this text where one of the surface labels can access it? The answer is surface description! For most of us, the surface object’s description field goes largely unused, and it serves as the perfect place to store the statistics data.
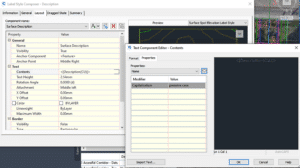
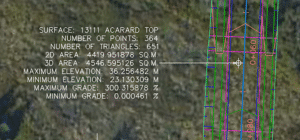
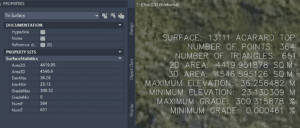
When a spot elevation label that shows the surface name and description is used, it looks something like this:
Just a general note: The surface statistics can also be stored on the surface as a property set.
If the surface undergoes any changes, we can update the statistics data stored in the descriptions (and the property set) by simply rerunning the same Dynamo script with a click of a button.
Dynamo has become the primary tool for many power users to automate various tasks in Civil 3D because it is so easy to put together.
We saw how surface statistic labelling may be done with Dynamo including:
If you need a solution to any Civil 3D project, we would be glad to help and find a specific Dynamo solution for you. Reach out to us at info@solidcad.ca
We are pleased to share with you the highlights of the latest Autodesk Desktop Connector update!
New Feature and Enhancement:
Resolved Issues
For more information, visit here.
In this vlog, our Civil/Infrastructure Technical Product Specialist, Jae Kwon, will demonstrate how to assign point layers by Note Column with Dynamo application.
Autodesk Dynamo is a programming environment that requires no programming experience. Dynamo enables designers to create visual logic so they can explore a wide range of parametric conceptual designs using logic, simple data and analysis without the need to create a physical prototype.
This vlog will cover a demo of: